│Severity & Probability Categories│Assessment Matrix│Priority List│Back│
Operational risk assessment (ICMA Standard ICMA-STD-1811)
Introduction
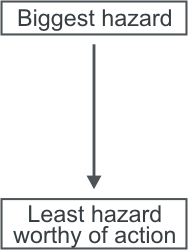
Risk assessment is the process which associates “hazards” with “risks”. When we know the various impacts a hazard may have on our mission and an estimate of how likely it is to occur we can now call the hazard a risk. The second aspect of risk assessment is the ranking of risks into a priority order. Figure 7 depicts the actions necessary to complete this step. The number one risk is the one with the greatest potential impact on the command mission. The last risk is the least risky issue that still may deserve some attention and possible risk control action. Keep in mind that this priority listing is intended to be used as a guide to the relative priority of the risks involved and not necessarily an absolute order to be followed. There may be, as an example, something that is not a terribly significant risk that is extremely simple to control.
The Components of Risk
There are three key aspects of risk. Probability is the estimate of the likelihood that a hazard will cause a loss. Some hazards produce losses frequently, others almost never do. Severity is the estimate of the extent of loss that is likely. The third key aspect is exposure, which is the number of personnel or resources affected by a given event or, over time, by repeated events. To place hazards in rank order we must make the best possible estimate of the probability, severity, and exposure of a risk compared to the other risks that have been detected.
Severity Categories
Determine the severity of the hazard in terms of its potential impact on the people, equipment, or mission. Cause and effect diagrams, scenarios and “What-If” analysis are some of the best tools for assessing the hazard severity. Severity assessment should be based upon the worst possible outcome that can reasonably be expected. Severity categories are defined to provide a qualitative measure of the worst credible mishap resulting from personnel error, environmental conditions; design inadequacies; procedural deficiencies; or system, subsystem, or component failure or malfunction. The following severity categories provide guidance to a wide variety of missions and systems.
- CATASTROPHIC—Complete mission failure, death, or loss of system
- CRITICAL—Major mission degradation, severe injury, occupational illness or major system damage
- MODERATE—Minor mission degradation, injury, minor occupational illness, or minor system damage
- NEGLIGIBLE—Less than minor mission degradation, injury, occupational illness, or minor system damage
Probability Categories
Determine the probability that the hazard will cause a negative event of the severity assessed in Action 2 above. Probability is proportional to the cumulative probability of the identified causes for the hazard. Probability may be determined through estimates or actual numbers, if they are available. Assigning a quantitative mishap probability to a new mission or system may not be possible early in the planning process. A qualitative probability may be derived from research, analysis, and evaluation of historical safety data from similar missions and systems. The typical mishap sequence is much more complicated than a single line of erect dominos where tipping the first domino (hazard) triggers a clearly predictable reaction. Supporting rationale for assigning a probability should be documented for future reference. The following are generally accepted definitions for probability:
- REQUENT
- Individual item - Occurs often in the life of the system
- Fleet or inventory - Continuously experienced
- Individual people - Occurs often in career
- All people exposed - continuously experienced
- LIKELY
- Individual item - Occurs several times in the life of the system
- Fleet or Inventory - Occurs often
- Individual people - Occurs several times in a career
- All people exposed - Occurs often
- OCCASIONAL
- Individual item - Will occur in the life of the system
- Fleet or Inventory - Occurs several times in the life of the system
- Individual people - Will occur in a career
- All people exposed - Occurs sporadically
- SELDOM
- Individual item - Could occur in the life of the system.
- Fleet or Inventory - Can be expected to occur in the life of the system.
- Individual people - Could occur in a career.
- All people exposed - Seldom occurs.
- UNLIKELY
- Individual item - So unlikely you can assume it will not occur in the life of the system.
- Fleet or Inventory - Unlikely but could occur in the life of the system.
- Individual people - So unlikely you can assume it will not occur in a career.
- All people exposed - Occurs very rarely.
Risk Assessment Matrix
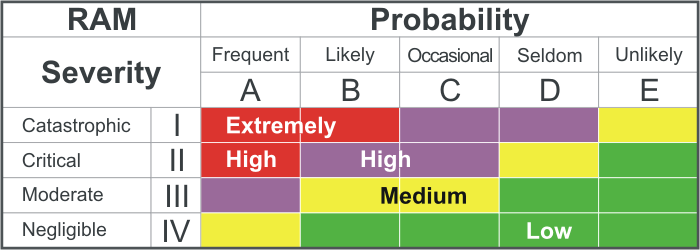
There are many ways to assess risk, but the easiest and most effective for routine risk management applications is the risk assessment matrix. The easiest way to understand the application of the matrix is to apply it.

Combine severity and probability estimates to form a risk assessment for each hazard. By combining the probability of occurrence with severity, a matrix is created where intersecting rows and columns define a Risk Assessment Matrix. The Risk Assessment Matrix forms the basis for judging both the acceptability of a risk and the management level at which the decision on acceptability will be made. The matrix may also be used to prioritize resources to resolve risks due to hazards or to standardize hazard notification or response actions. Severity, probability, and risk assessment should be recorded to serve as a record of the analysis for future use. Existing databases, Risk Assessment Matrix, or a panel of personnel experienced with the mission and hazards can be used to help complete the risk assessment.
The outcome of the risk assessment process is a list of risks developed from the output of the hazard identification process. The first risk is the most serious threat to the mission, the last is the least serious risk of any consequence). Each risk is either labeled with its significance (high, medium, etc.) or the section in which it is place is labeled. This allows us to see both the relative priority of the risks and their individual significance.
There are some problems involved in using the matrix. These include the following:
Subjectivity: There are at least two dimensions of subjectivity involved in the use of the matrix. The first is in the interpretation of the matrix categories. Your interpretation of the term “critical” may be quite different from mine. The second is in the interpretation of the hazard. If a few weeks ago I saw a machine much like the one to be moved fall over and crush a person to death, I might have a greater tendency to rate both the probability and severity higher than someone who did not have such an experience. If time and resources permit, this variation can be reduced by averaging the rating of several personnel.
Inconsistency: The subjectivity described above naturally leads to some inconsistency. A hazard rated very high in one organization may only have a high rating in another. This becomes a real problem if the two hazards are competing for a limited pot of risk control resources (as they always are). There will be real motivation to inflate risk assessments to enhance competitiveness for limited resources.
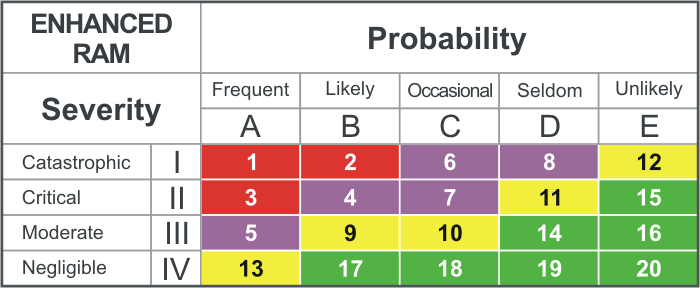
Lack of a range of rankings: The standard matrix produces only four level of risk i.e. EH, H, M and L. The highest level, EH, will normally be corrected almost immediately. The lowest level, L, are often so minor that they do not warrant serious consideration. This means that the vast majority of meaningful hazards are either H or M. When we try to construct a risk totem pole we are still faced with a big prioritization problem since most meaningful risks are in only two categories. An option to overcome this problem is to assign numbers to each block of the matrix. These numbers can then be used to augment the basic categories. An example is shown below. Note that the modified matrix provides 20 levels of risk. Note that the numbers do not replace the basic EH, H, M and L categories, they augment them. Additionally, be aware that although the levels are arranged so that the higher risks have a low number, the matrix can be constructed so high numbers reflect higher risk levels. Use whichever method best suits your organizational needs without creating a conflict.

Risk Priority List
By ranking the hazards, we can work them on a worst first basis.  This is vital because risk control resources are always limited and should be directed at the big problems first to assure maximum bang for the buck. In the fully mature ORM world, every individual benefits from the knowledge of the priority of hazards that exist in their life. A key obligation of leaders is to see that their subordinates possess this knowledge.
The risk totem pole is designed to display the hazards of an operation in a top down order of priority. The highest risk hazard is placed at the top of the totem pole with progressively less risky hazards displayed in order of priority below it. All hazards are displayed on the totem pole until the risk is so low that the hazards are not likely to warrant any expenditures of resources to control them. It is desirable to indicate the risk rating (extremely high, high, medium, low) for hazards by either labeling each hazard or by labeling each group. The totem pole is used to assure that risk issues are attacked on the basis of worst first and that the greatest resource expenditures are focused on the worst hazards.
Because the totem pole lists all the hazards in order of importance, it helps to prioritize risk control efforts. This is the basic purpose of the totem pole, but it can do other things for us. For example, it is also useful to see different hazards that may be attacked with a single risk control. In the example above, several hazards arise from the potential of the heavy, unstable machine to fall over causing injury or damage. One potential risk control - attaching the machine to a wider, more stable base before lifting and moving it may reduce the risk from all these related issues. We can also use the risk totem pole to break the overall list of hazards out into clusters of related risk issues so that the responsible personnel for those areas can address them in order of priority. This can be a positive step toward integration of risk management roles.
Assessment Pitfalls
The following are some analytical pitfalls that should be avoided in the assessment:
- Overoptimism: “It can’t happen to us. We’re already doing it.” This pitfall results from not being totally honest and not looking for root causes of risk.
- Misrepresentation: Individual perspectives may distort data. This can be deliberate or unconscious.
- Alarmism: “The sky’s falling” approach, or “worst case” estimates are used regardless of their remote possibility.
- Indiscrimination: All data is given equal weight.
- Prejudice: Subjectivity and/or hidden agendas are used, rather than facts.
- Inaccuracy: Bad or misunderstood data nullifies accurate risk assessment.
- It is difficult to assign a numerical value to human behavior.
- Numbers may oversimplify real life situations.
- It may be difficult to get enough applicable data, which could force inaccurate estimates.
- Oftentimes numbers take the place of reasoned judgment.
- Risk can be unrealistically traded off against benefit by relying solely on numbers.


